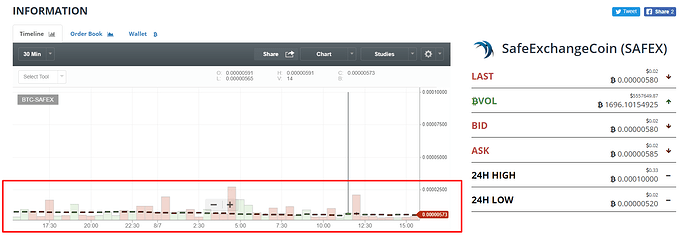
Been like this for a few hours now on Bittrex
Change to line graph
Yeah I’ve changed it but why is it happening? I like the candle which is by default, but not working for safex. Al others fine.
Change your timeline to 1 minute. And press the + button to adjust. Im guessing the charts look like that because of the 33 cent jump earlier.
Perfect! That did the trick. Thanks!
No problem, Had the same issue earlier.
Just change the chart from 30 mins, to 15, and the candles will show back up
It’s also about 24 hours behind on Cryptocompare. Anyone know why?
I’m putting the Bittrex chart on Log scale, as the reason it’s not showing properly is the massive candle of a buy yesterday - at something like 10k sats, way more than any other transaction on SAFEX. So the chart can’t show the full vertical scale, meaning that bar that one candle, all we get is a more-or-less flat line… Will sort itself out in time 
This is because somebody paid 10000 satoshi for a coin (for some reason) and the chart has to zoom out to accommodate the high price on this candlestick. The same thing happened this morning on the BTC/EUR GDAX chart - somebody paid €5000 for 1 BTC and now the rest of the chart is squished into the bottom third of the screen.
